
Abstract of 2015 SIPO Patent investigation report
The report is investigated by the State Intellectual Property Office of the P.R.C (SIPO) with sample questionnaires of patent owners with effective patent in the end of 2014. The patent owners are classified into corporation, school, research institute and personal in order to analyze their differences in research and development (R&D) activity, patent enforcement, and patent protection. The report also provides trend of recent years.
R & D Activity
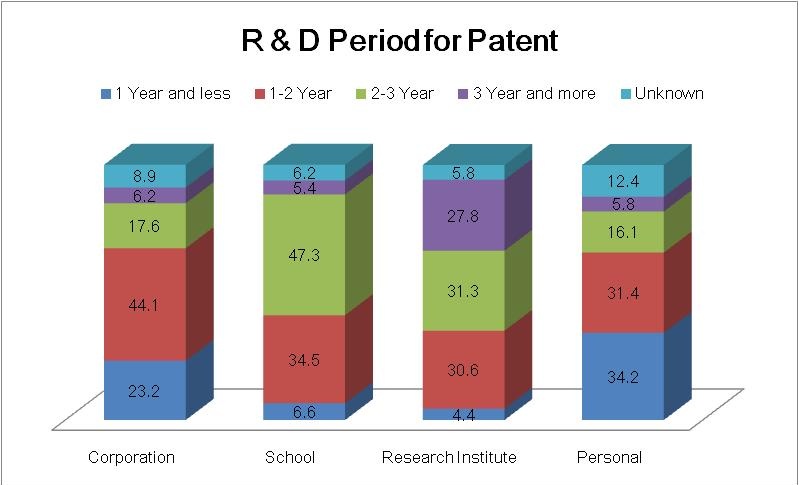
Investigation revealed that there are 83.1% patent owners having R& D period less than 3 years. As shown in Fig 1, for corporation patent owners, the R& D period is mostly among 1 to 2 years and for personal is most less than 1 year. The distributions for school and research institute are similar that they have longer R&D period to be among 2 to 3 years in major.
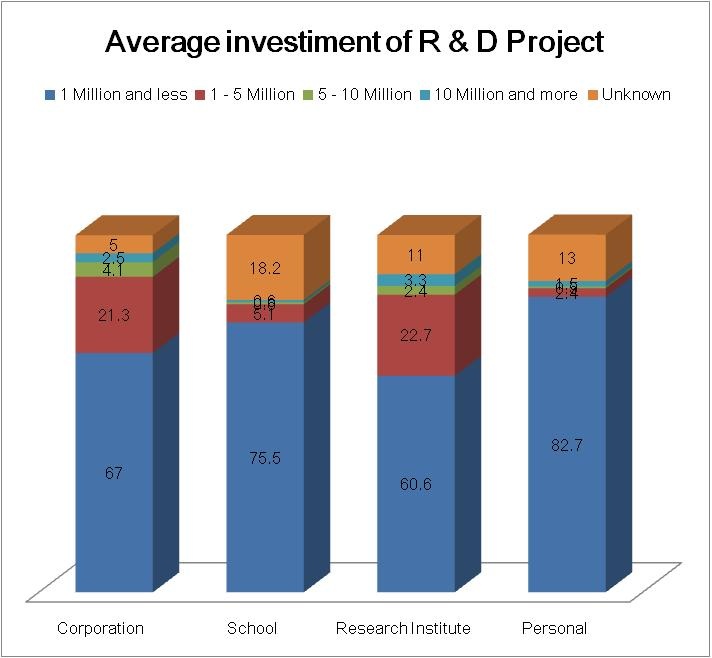
Most patent owners have average investments for R&D project are less than 1 million CNY as shown in Fig 2. The distributions of corporation and research institute are similar to have higher percentage of investment among 1 to 5 million CNY. There are considerable proportions of school and personal patent owners who did not know the average investment of their R &D projects.
Patent Enforcement
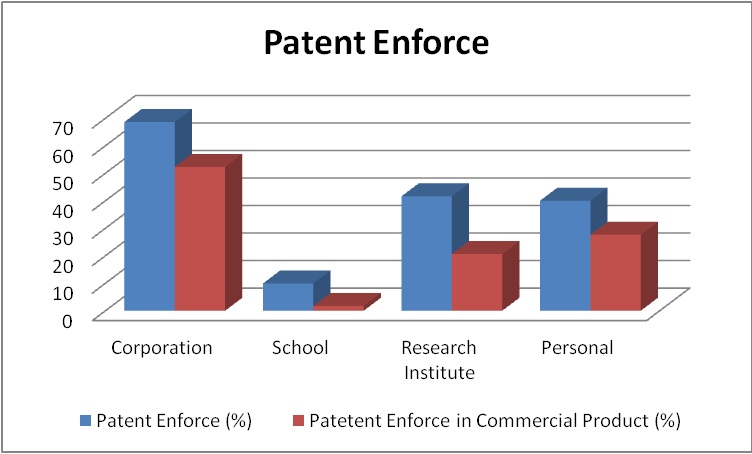
Among the effective patents, the enforcement percentage for corporation is highest to be 68.6% and the next are research institute and personal to be 41.6% and 40% separately. The major enforcement type is commercial product, the highest proportion of patents having commercial products belongs to corporation to be 52.3% and the next is personal patent owners to be 28.6%. The proportion of patents having commercial products for research institute is 12.1% which is much lower than the ratio of patent enforcement and indicates that the way research institute enforces their patent is different from corporation and personal patent owners.
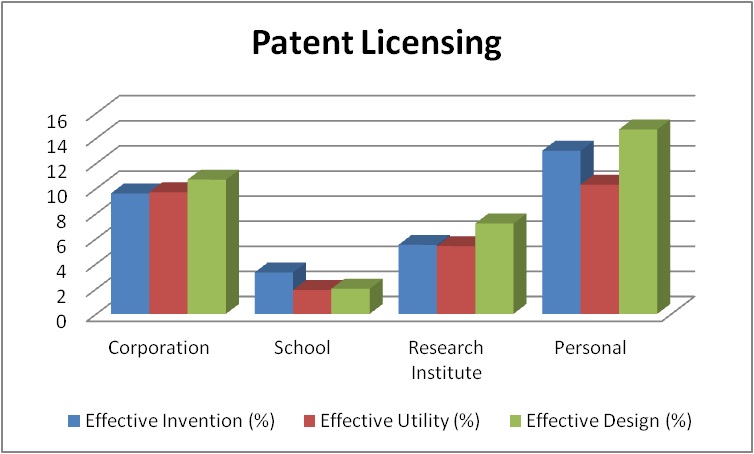
Investigation revealed that according to patent owner types, personal patent owners have higher percentage of patent licensing, which is less for corporation and research institute in Fig 4 . Analysis with patent kinds showed that design patents have the highest licensing proportions (12.1%). For patent licensing, there are only slight differences between invention and utility patent to be 8.2% and 9.3% separately.
Patent Protection
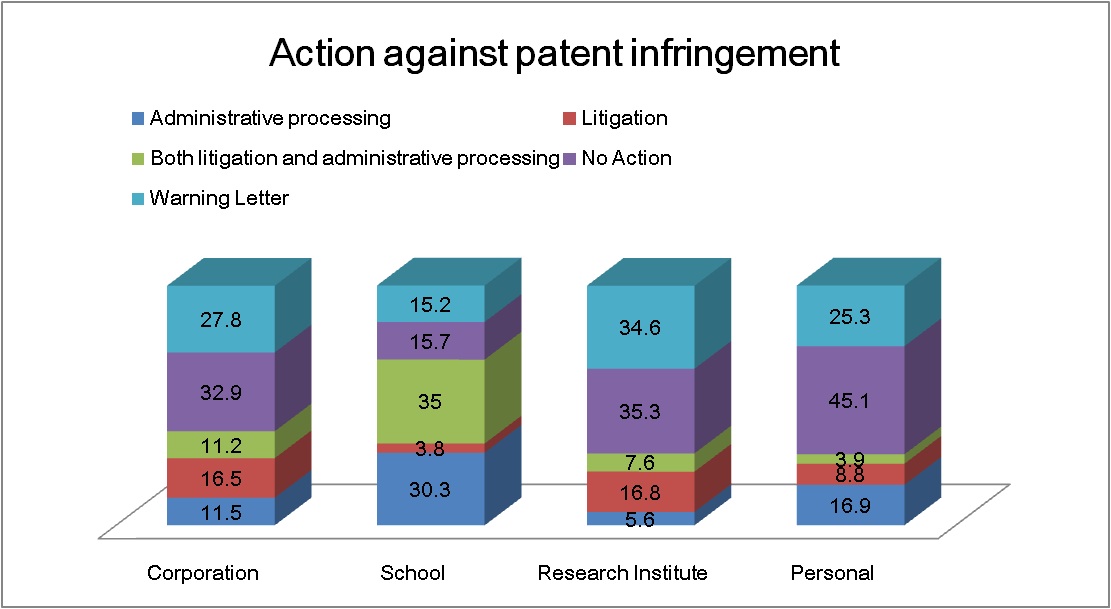
There are 14.5% patent owners have encountered patent infringement, most are corporation and research institute to have 18.4% and 14.6% separately and only 5.5% of school to be the lowest. 38.2% of the patent owners who encountered patent infringement take no action against infringer and it is common for corporation, research institute and personal patent owners with percentages over 30%, but the ratio for school is almost half and only 15.7% take no action. Corporation, research institute and personal patent owners are tend to take peaceful action such as sending warning letters and the ratio is 34.6%, 27.8% and 25.3% separately. Patent owners of school preferred aggressive actions such as both administrative processing and litigation (35%) and administrative processing (30.3%). Please refer Fig 5 for details.
Trends
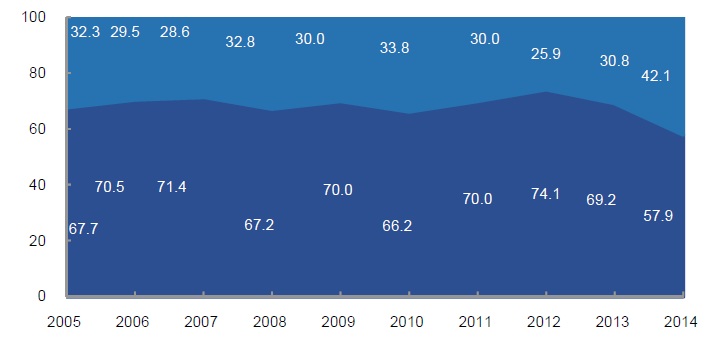
In recent 10 years, the ratios of patent enforcement are in the range of 57% – 75%, the highest ratio occurred in 2012 to be 74.1%. However, the ratio decreased in 2013 and in 2014, the ratio is 57.9% to be the lowest over years. The trend are shown in Fig 6, where light blue indicates no patent enforcement and navy blue indicates patent enforcement.
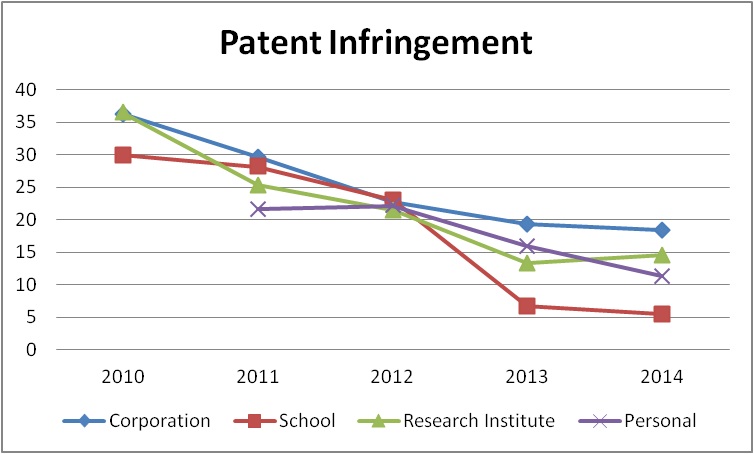
Investigation revealed that the ratio of patent owners who encountered patent infringement decayed over past 5 years. For corporation, the ratio in 2010 is 36.3% and decreased into 18.4% in 2014 and it is 36.5% to 14.6% for research institute. For personal patentees, the infringement encountering ratio is from 21.6% in 2011 to 11.4% in 2014. Fig 7 showed the trends and it revealed that the intellectual property protection is effective.
Reference Data:
(1)2015 China Patent Investigation Data Report(http://goo.gl/yl8qkz)
Author:
Project Leader Maii Kuo